Reports & Analytics
All your business numbers in one place — from today's cash to VAT payable, purchase tax recoverable, and the balance sheet. Core reports are available for daily operations; deeper accounting reports are available on Pro.
Reports Dashboard
The Reports section is your analytics hub. It is split into individual reports, each focused on a specific part of your business. Use the navigation at the top of the Reports page to jump between them. All reports support a date range filter so you can view data for any period — today, this week, this month, a custom range, and more.
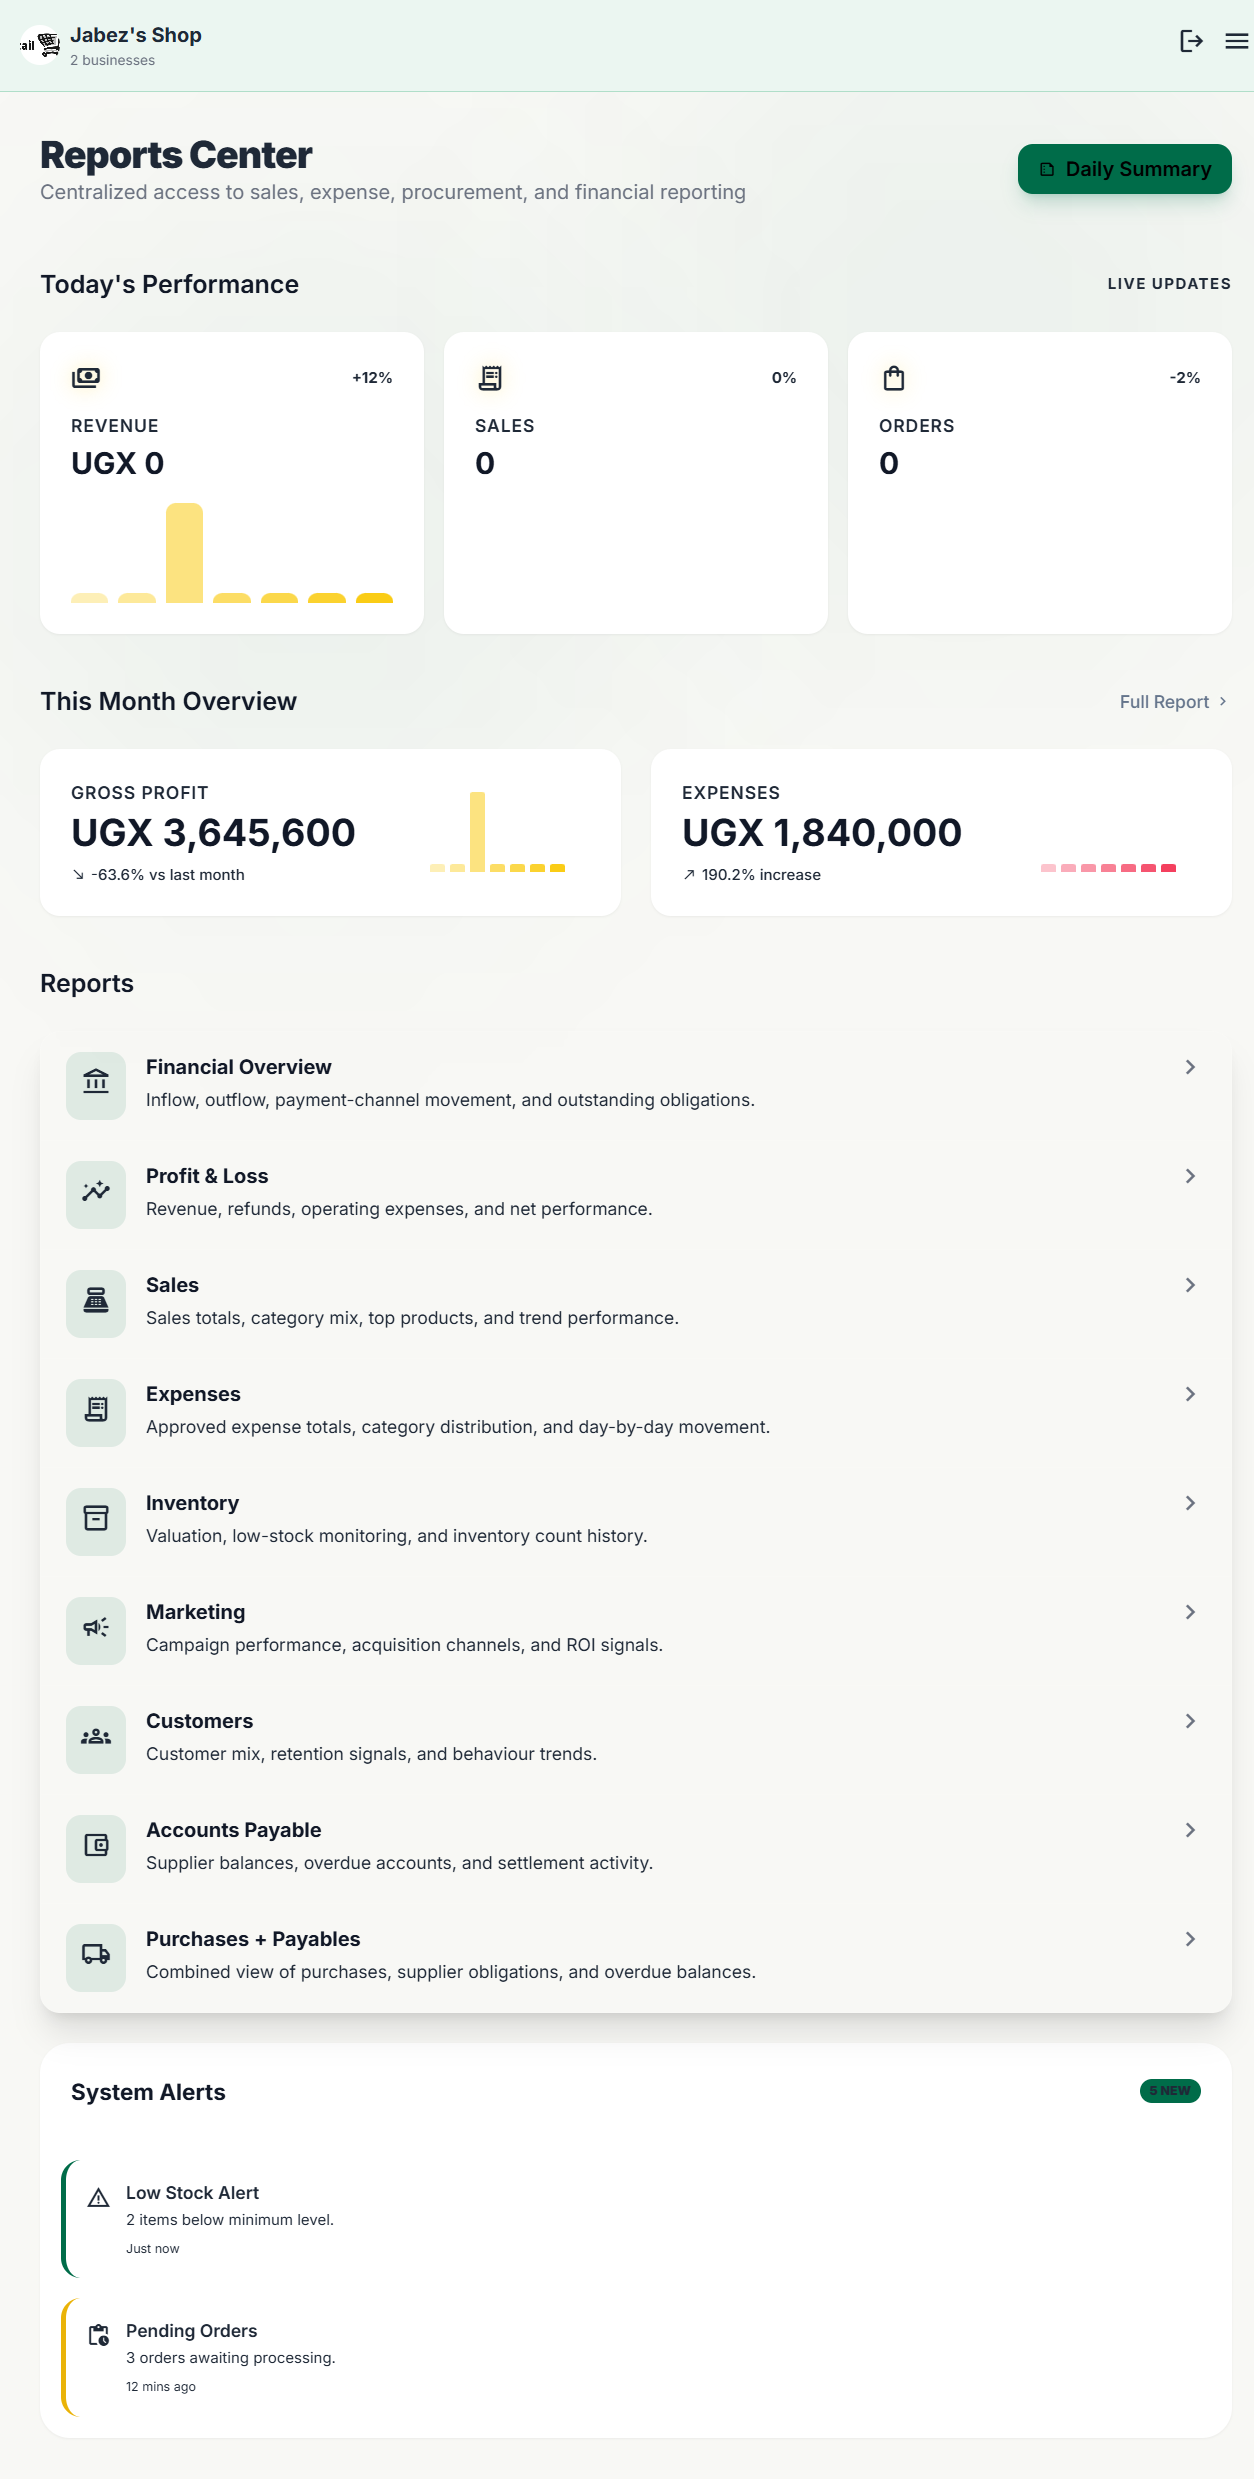
Daily Summary
The Daily Summary gives you a snapshot of a single day's activity — useful for a quick end-of-day review. It shows:
- point_of_sale Total revenue from sales and orders completed that day.
- payments Breakdown by payment method — how much came in via cash, Mobile Money, etc.
- account_balance_wallet Expenses recorded that day.
- trending_up Gross profit for the day.
Profit & Loss
The Profit & Loss report shows whether your business is making or losing money over any period. It calculates:
| Line | What it is |
|---|---|
| Revenue | Total value of all sales in the period. |
| Cost of Goods Sold (COGS) | The purchase cost of the items sold (FIFO basis). |
| Gross Profit | Revenue minus COGS. |
| Operating Expenses | All expenses recorded in the period (rent, salaries, etc.). |
| Net Profit | Gross Profit minus Operating Expenses. |
A negative net profit means expenses are exceeding your gross profit. Use this report monthly to spot trends and make decisions about costs or pricing.
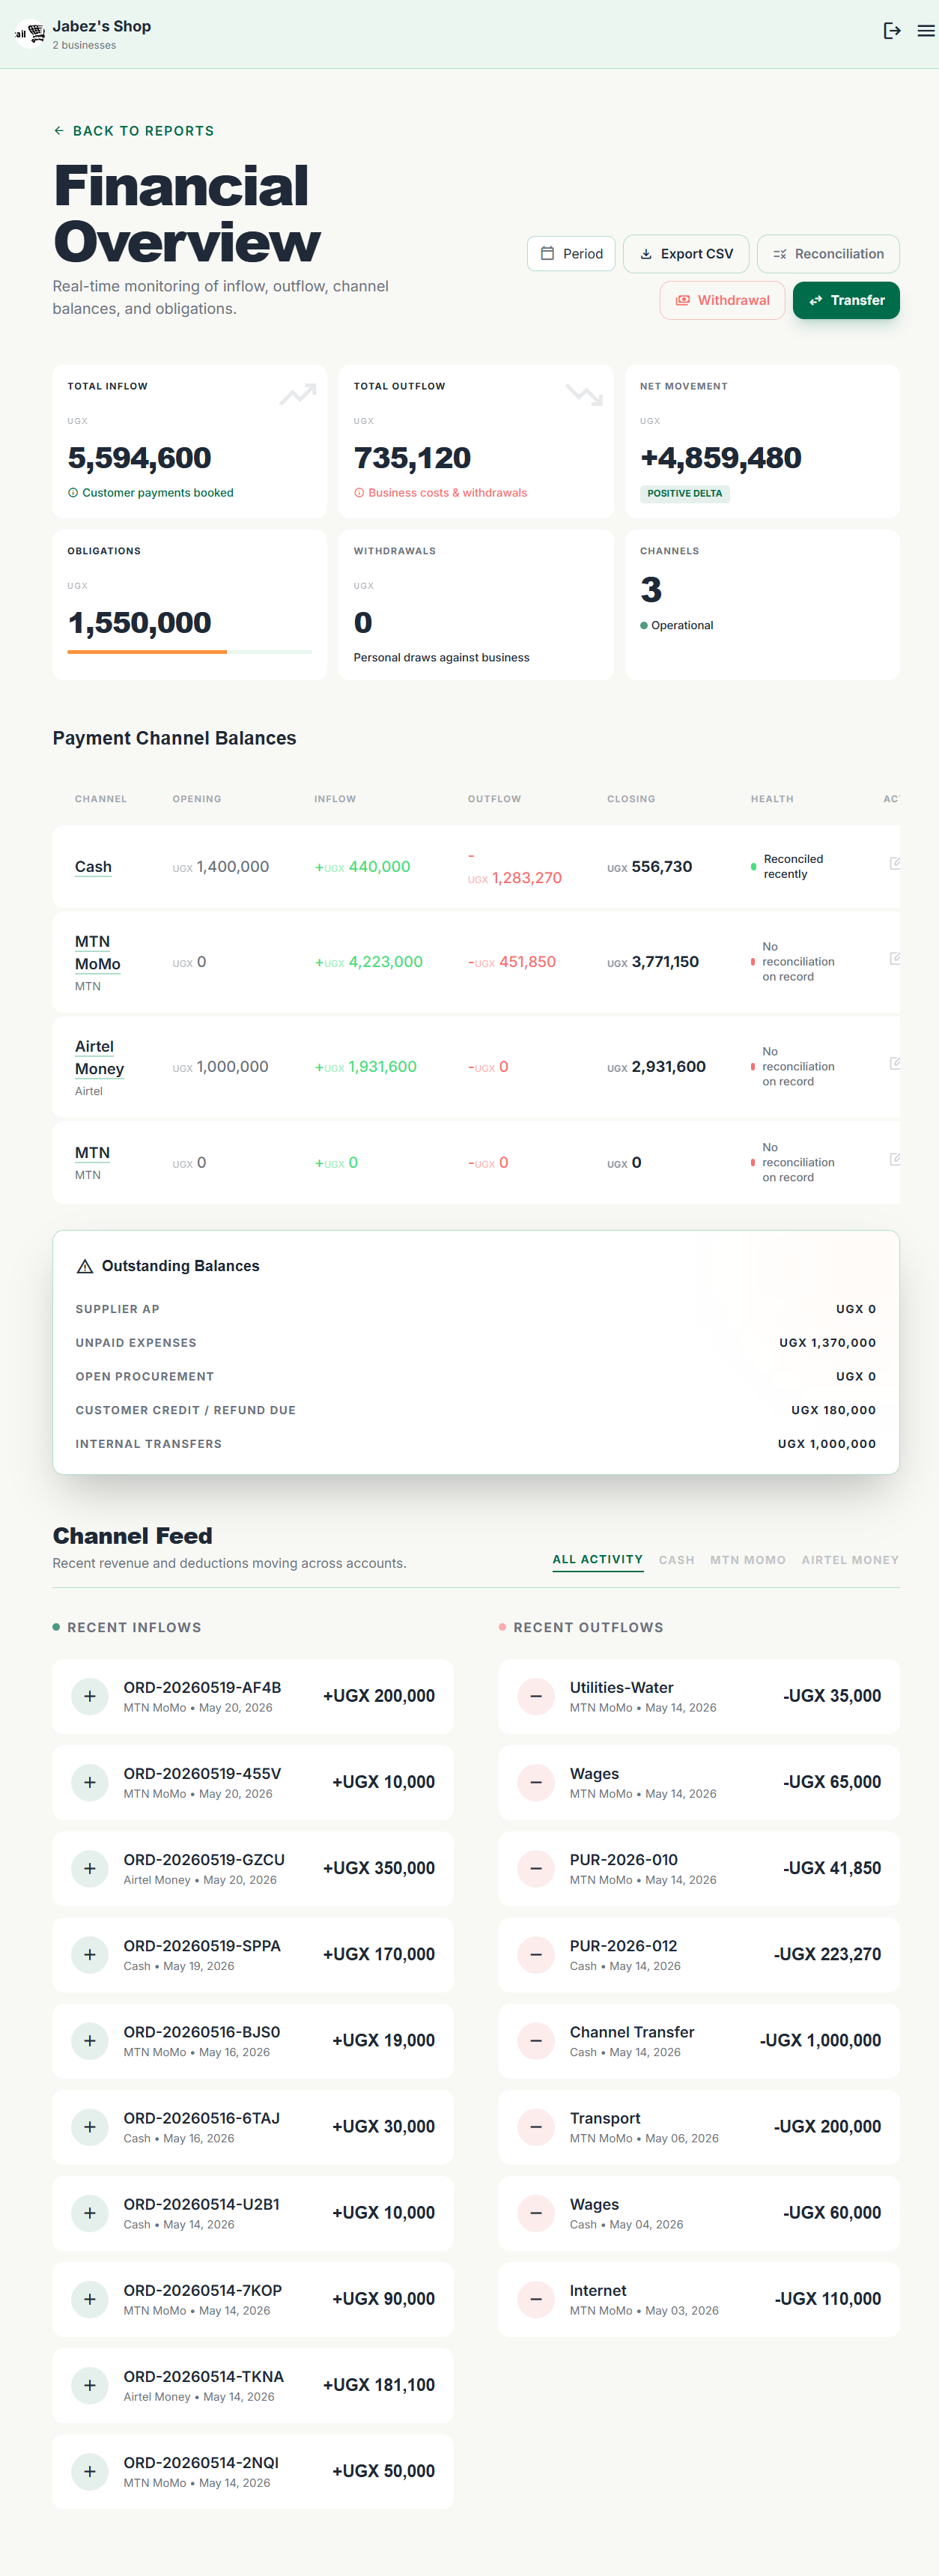
Financial Overview
The Financial Overview is the most detailed financial view in MyShop. It gives the business owner a full picture of cash flow, channel performance, and outstanding obligations — all in one screen.
The top section shows six summary cards covering revenue, expenses, net profit, receivables, payables, and current cash position. Below that:
- table_chart Channel table — Revenue broken down by payment method (cash, MoMo, bank, etc.), showing what percentage came from each channel.
- pending_actions Outstanding sidebar — A combined view of customer balances owed to you and supplier balances you owe.
- timeline Channel feed — A time-ordered log of cash movements across all payment channels.
Owner-level actions available from this page:
Transfer
Record a movement of funds between your own channels (e.g. move cash from the till into the bank account).
Withdrawal
Record money taken out of the business by the owner — kept separate from expenses so it doesn't distort your profit calculation.
Set Opening Balance
Set the starting cash position for a channel at the beginning of a period, so your running totals are accurate from day one.
Reconcile
Lock a channel's balance at the end of a period, confirming the system figure matches your physical cash count or bank statement. A reconciliation history is kept for your records.
You can export the Financial Overview data to CSV for further analysis.
VAT Center
The VAT Center gives owners a protected VAT view across sales, purchases, and VAT payments. It is designed for shops that need to separate collected VAT from operating revenue and keep payment evidence attached.
VAT Payable
The VAT balance still owed after recorded VAT payments up to the report date.
Sales VAT
Protected VAT collected from tax-aware sales, net of reversals and refunds.
Purchase Tax Recoverable
Protected VAT on confirmed purchases, shown separately from ordinary stock cost.
VAT Payments & Receipts
Record VAT payments by channel, attach receipts or tax documents, and keep a payment history for review.
VAT payable and purchase tax recoverable also flow into the Balance Sheet, so tax obligations are visible in the financial position of the business.
Balance Sheet
The Balance Sheet shows the financial position of the shop as of a chosen date. It brings together current assets, fixed assets, liabilities, and owner's equity so you can see whether the business equation is aligned.
| Section | What MyShop includes |
|---|---|
| Assets | Cash and equivalents, accounts receivable, FIFO inventory, purchase tax recoverable, fixed assets at net book value. |
| Liabilities | Accounts payable, unpaid expenses, customer refund liabilities, VAT payable, short-term and long-term loans. |
| Equity | Capital contributions, opening equity, retained earnings, current-period profit, withdrawals, and system-inferred adjustment where needed. |
Use the date selector to view the statement as of month end or any custom date. You can export the balance sheet to CSV or print it for review.
Sales Report
The Sales Report shows all transactions (Quick Sales and Orders) over any period. Use it to:
- check_circle See revenue by day, week, or month.
- check_circle Filter by cashier — useful for tracking individual staff performance.
- check_circle See discounts given and their impact on revenue.
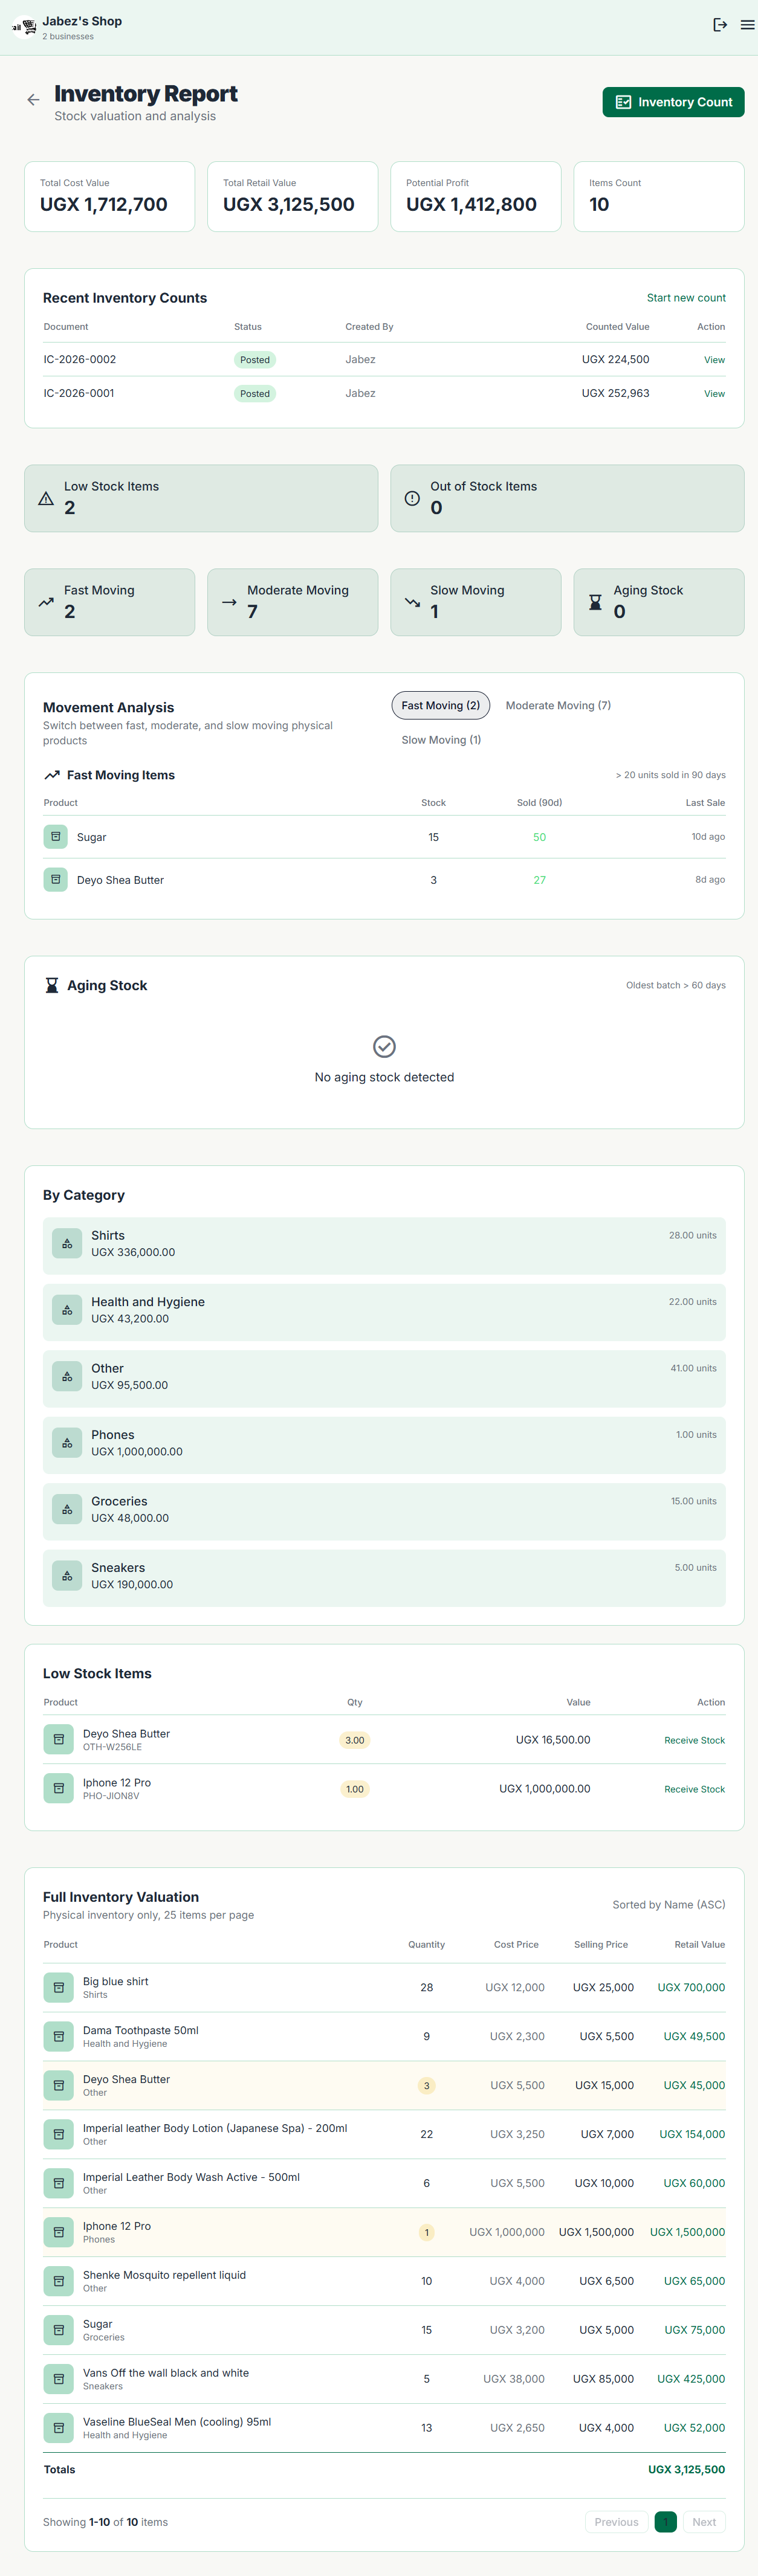
Inventory Report
The Inventory Report is the most detailed view of your stock. It includes four summary cards (total products, total stock value, low stock alerts, out-of-stock count) and then:
Stock Alerts
Products at or below their reorder threshold, highlighted for immediate action.
Movement Analysis
Products are automatically grouped by how fast they sell over a 90-day window:
Aging Stock
Products whose oldest stock batch has been sitting unsold for a long time. This helps you identify items to discount or liquidate before they become a write-off.
Inventory Count
A guided workflow for physically counting your stock and reconciling it against the system. Step by step:
- Start a new count session.
- Physically count each product and enter the actual quantity you find.
- MyShop shows the variance — difference between expected and actual stock.
- Review the variances and approve them.
- Confirm — the system is updated to match your physical count.
Product Performance
This report ranks all your products by revenue, units sold, or gross profit. Use it to find your top earners and your worst performers. You can filter by category and date range.
This is the quickest way to answer "What are my best-selling products this month?" and "Which products generate the most profit?"
Expenses Report
Shows all expenses over a chosen period, broken down by category. Use it to see which costs are growing, which are fixed, and where you might cut back. You can also compare two periods side by side to spot changes.
Marketing Report
If you've been recording the marketing source on orders (how customers heard about you), this report shows which channels drive the most orders and revenue — social media, referrals, walk-in, and so on.
Use it to make informed decisions about where to spend your marketing budget. Sources are configured in Settings → Marketing Sources.
Customer Report
Ranks your customers by total spend, order count, or average order value. Useful for identifying your highest-value customers and customers who haven't bought in a while.
Purchases & Payables
A report focused on the supplier side of your business. Shows total purchasing spend by supplier over any period, and lists all outstanding payables — how much you still owe each supplier and when it's due.
Use this before making supplier payments to know exactly who to pay and how much.
Payment Method Summary
Shows how much revenue was received via each payment method — cash, Mobile Money, bank transfer, credit, and any custom methods you've set up. Useful for understanding your cash-to-digital ratio and reconciling your till at the end of the day.